Redesigning Kip Control: Solving Discoverability and Usability Challenges
Adi Manjunath, Principal Software Engineer
Published January 15
Introduction
The year was 2019. Kepler Group was in an exciting growth era with a rapidly evolving client portfolio. Its clients expected strong marketing performance, real-time insights, and clear communication.
To meet these needs, we built a tool to make structured, timely insights accessible to all Kepler teams and clients –– Kip Control. However, like many products built quickly to meet urgent needs, Kip Control's original design was far from perfect. Flaws ranging from content overload to an inefficient layout prevented it from ultimately delivering on its intended purpose.
By observing the behavior of Kip Control version 1 and seeing how use cases contributed to both joy and frustration, we were able to conceive and build version 2. While we won't claim version 2 is THE answer, it's a marked improvement.
By diving into the ups and downs of our ongoing journey, we hope that you, the reader, may find inspiration, hope, and hard-earned wisdom to help in your own product development journey.
Why We Built Kip Control (Version 1)
By 2019, Kepler’s marketing campaigns had become more complex, requiring consistent analysis and optimization. The initial version of Kip Control aimed to address these needs. It was a promising start –– we automated the generation of marketing campaign analyses and insights, and teams could review and act on up-to-date data quickly, which streamlined decision-making.
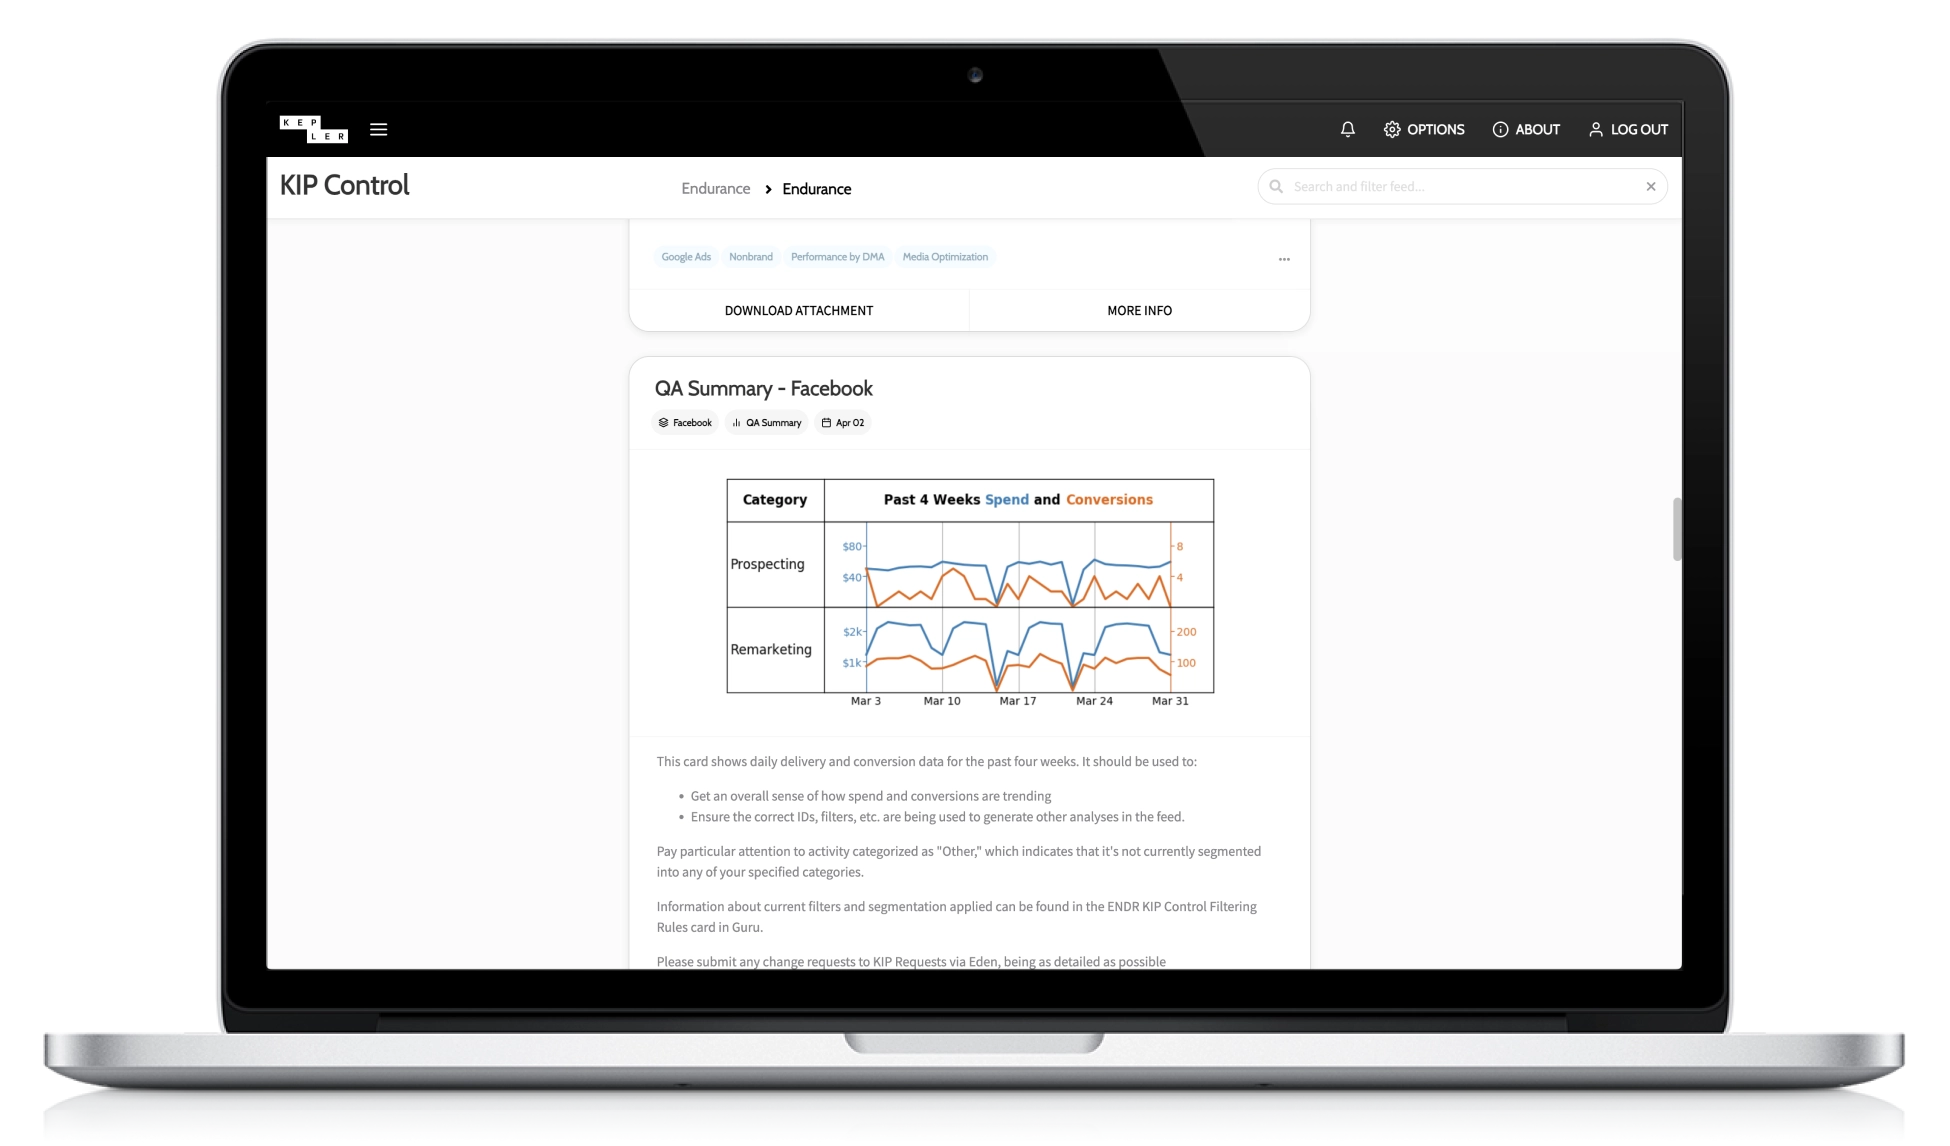
For a while, it worked. Cards presented key metrics clearly, and automated updates kept content fresh. But as Kepler and Kip Control scaled, cracks in the design began to show. What once felt like a helpful assistant started feeling more like an overworked intern, losing track of where things were and how to prioritize them.
The Problems with Version 1
Kip Control version 1 had its virtues, but as the company scaled, its limitations became impossible to ignore. Feedback revealed users often felt like they were navigating a maze, searching for insights buried beneath endless scrolls and layers of dropdowns. Their frustrations boiled down to four key pain points:
- Information Overload: Feeds overflowing with updates (weekly, bi-weekly, monthly—you name it) made finding relevant insights like searching for a needle in a haystack.
- Endless Scrolling: The single-column layout meant users had to scroll past oversized cards one by one.
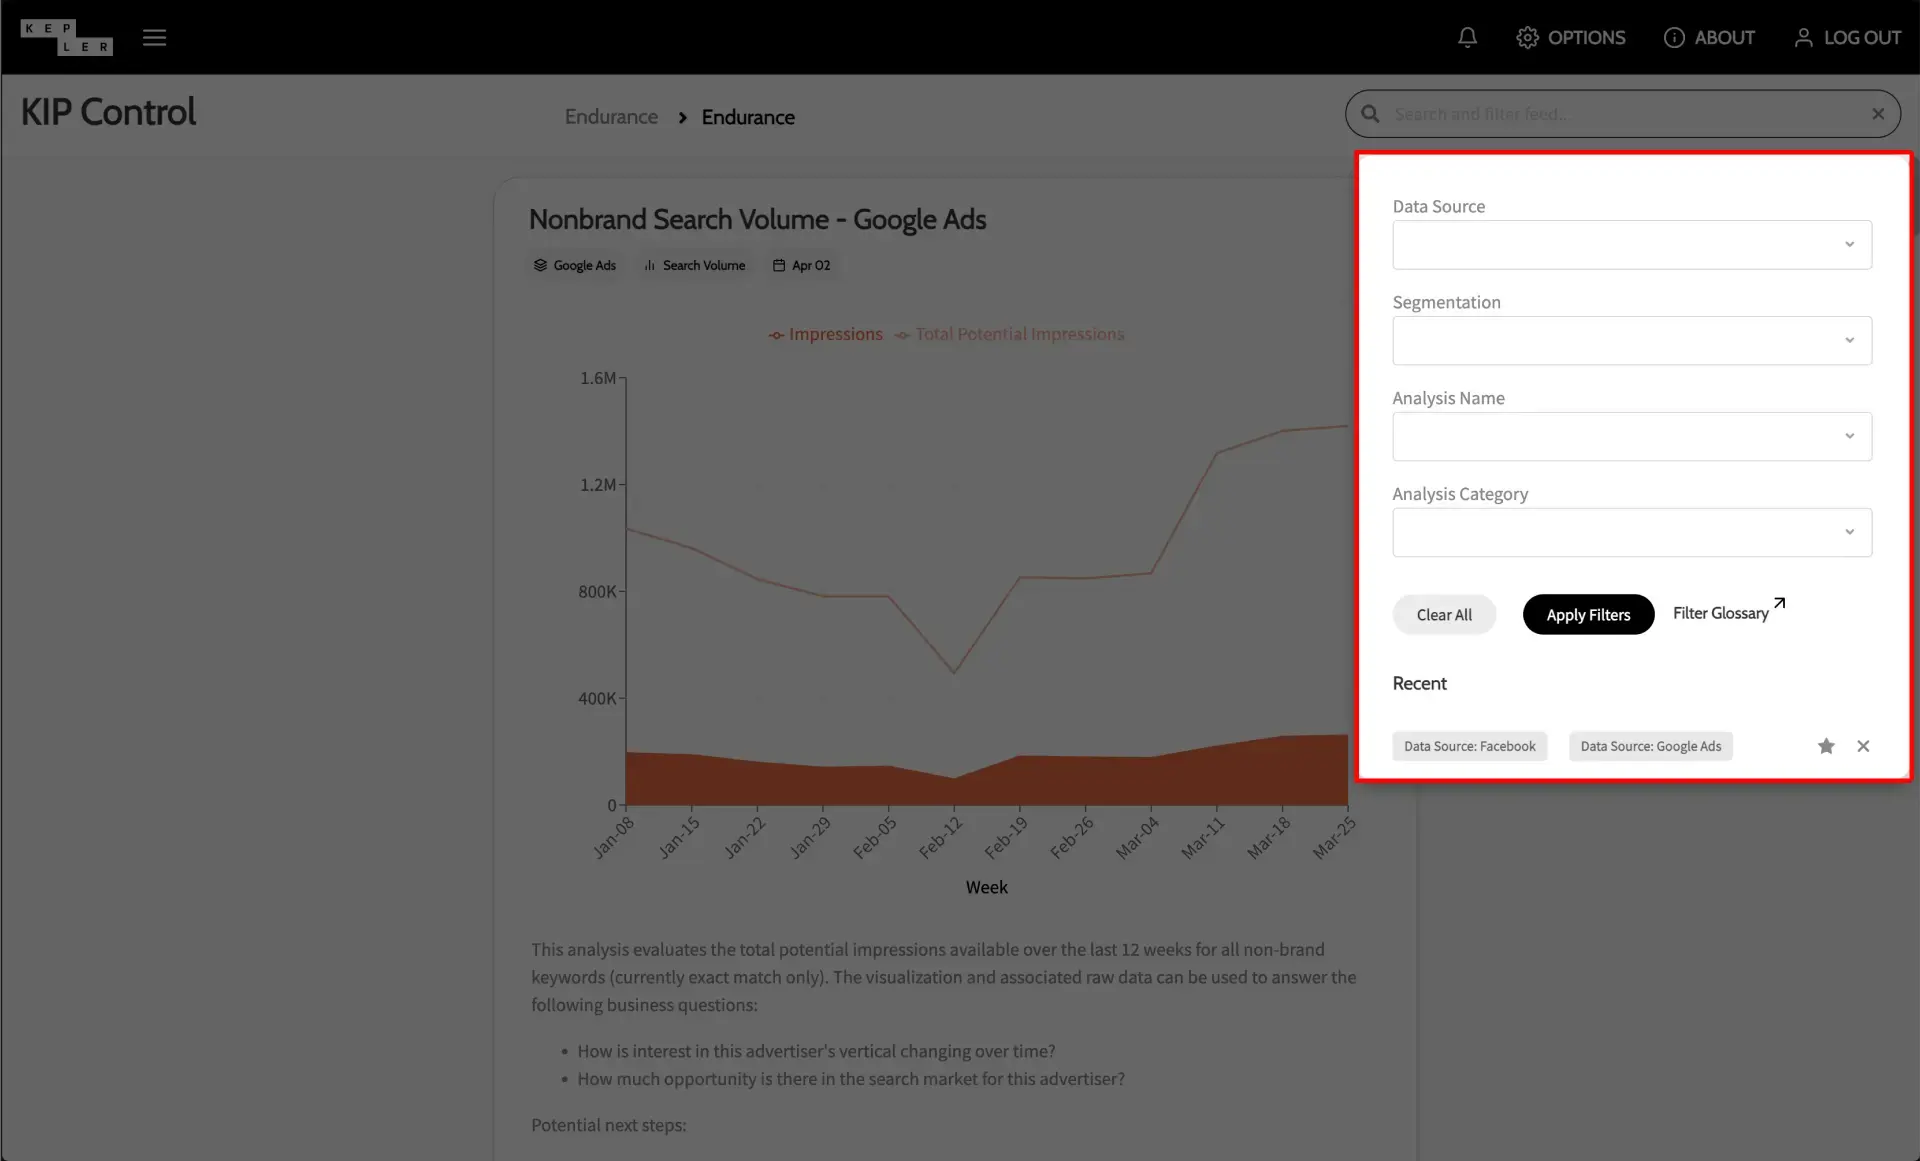
- Hidden Filters: The filters –– initially designed to help –– were tucked away in dropdowns, more "out of sight, out of mind" than "easy to use."
- DIY Reporting: Frustrated by the clutter, many users abandoned ship and went back to creating reports from scratch.
These flaws weren’t just annoying –– they were a direct obstacle to the tool’s mission. A redesign wasn’t just desirable; it was necessary.
Introducing Kip Control Version 2
Fixing v1's shortcomings required more than a few tweaks. It meant reimagining how users interacted with the tool.
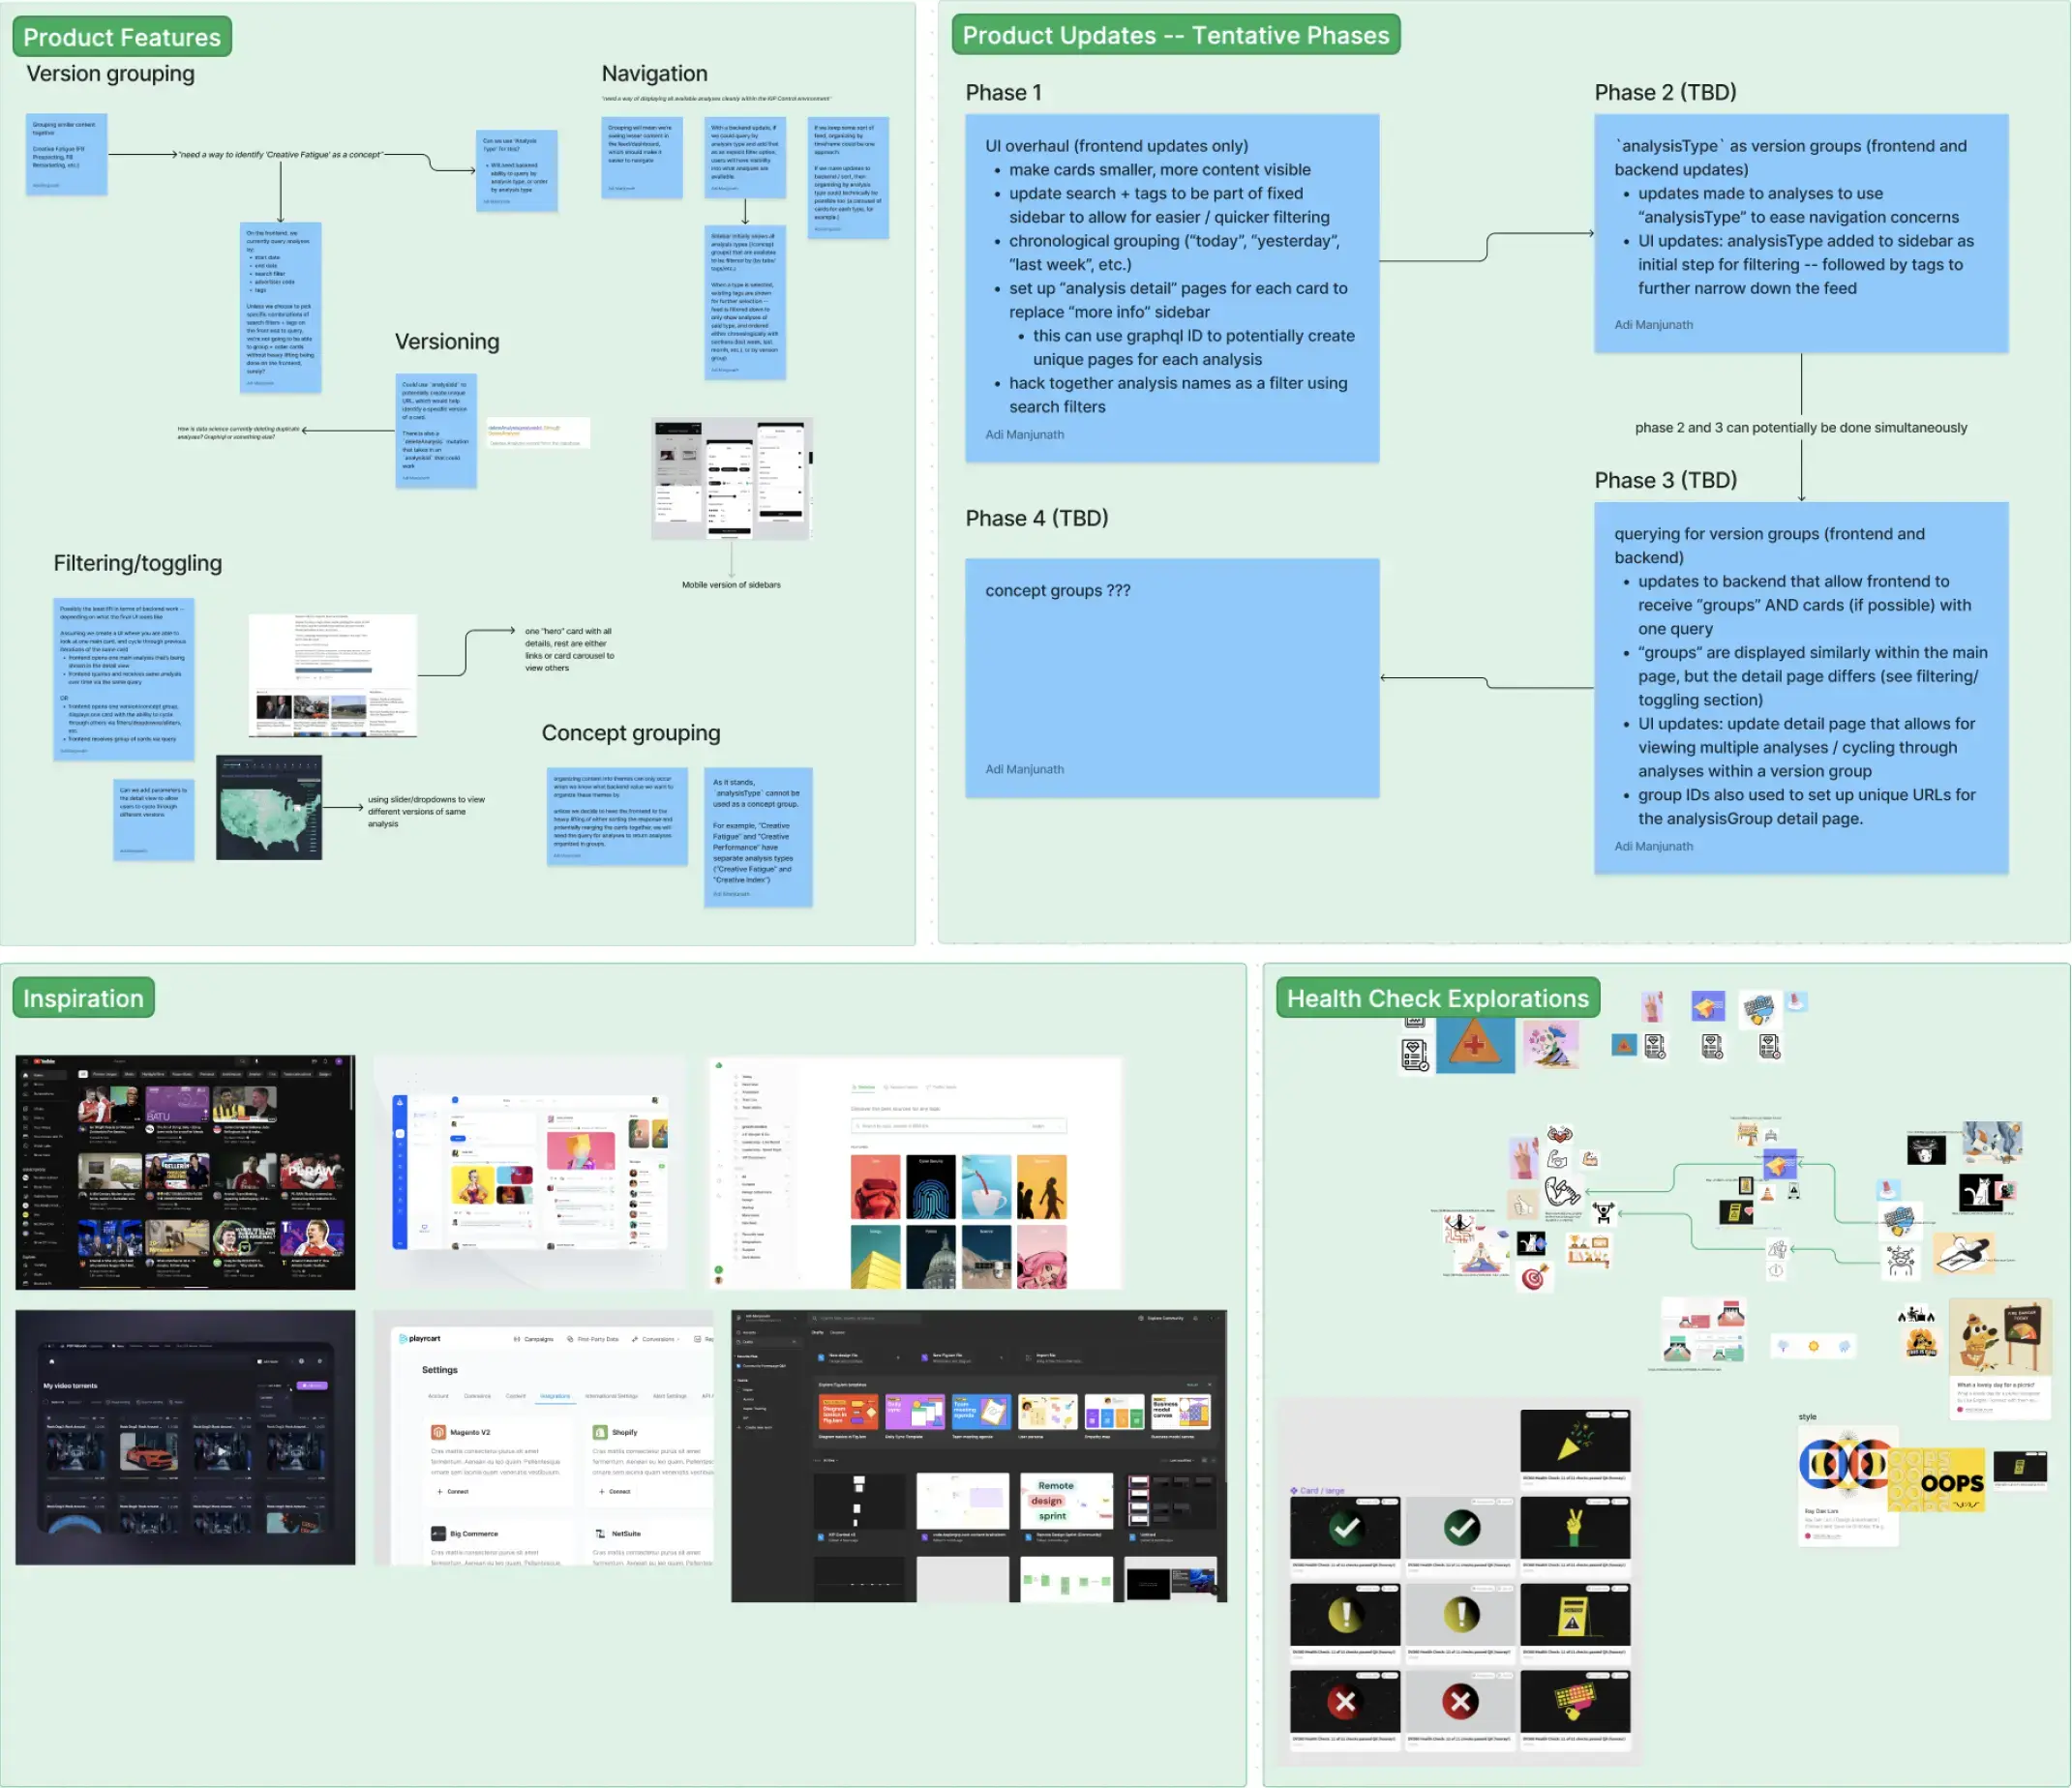
We focused on two core goals: improving discoverability and enhancing usability.
What We Changed
The most transformative updates tackled visibility and navigation head-on.
1. Enhanced Discoverability with Redesigned Filters
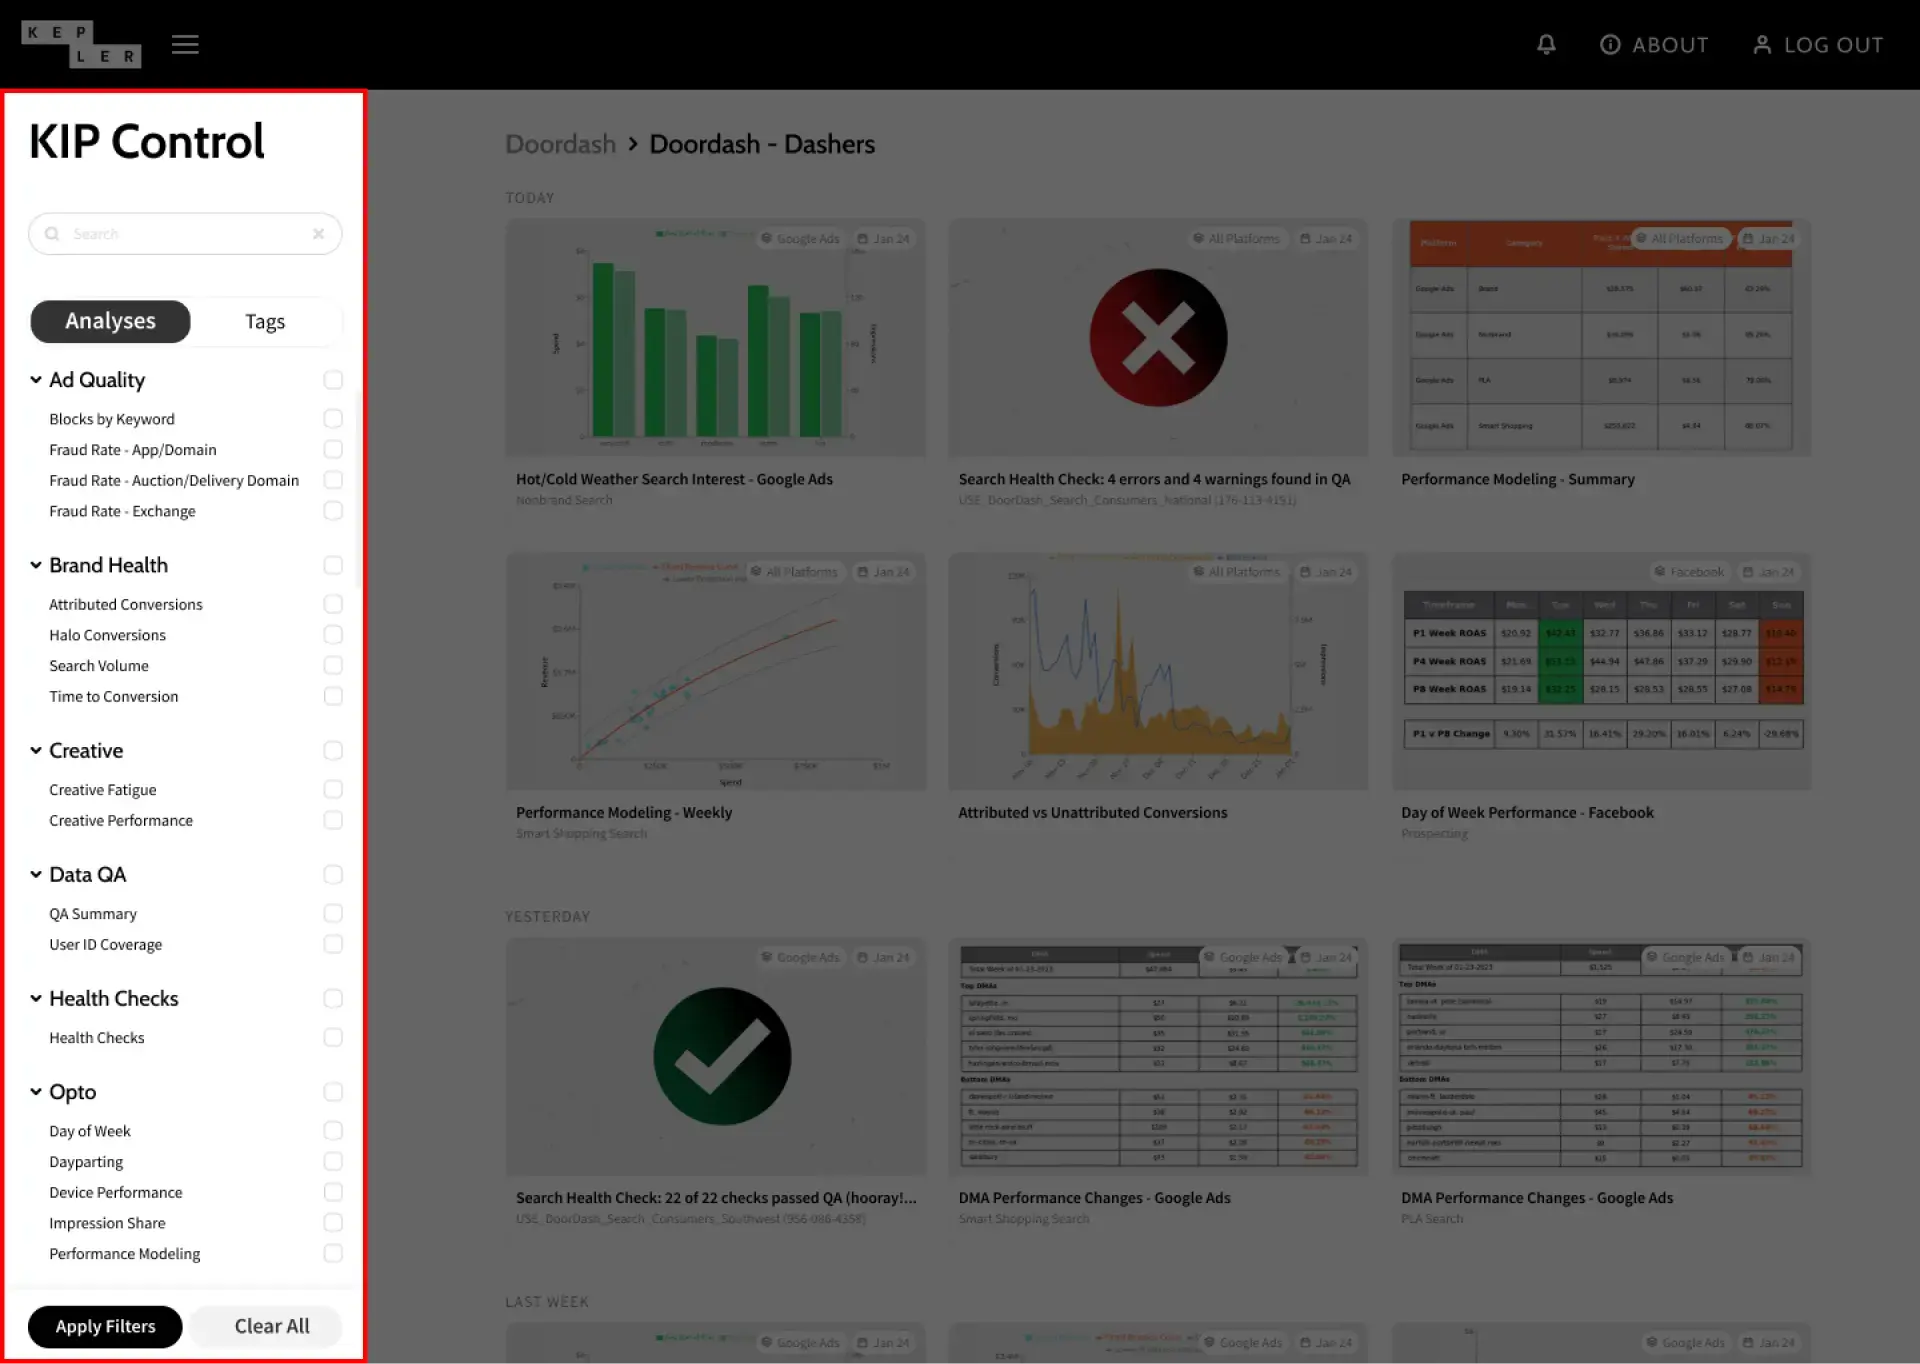
We expanded filtering options to include analysis name and type, moving these filters into a prominent, fixed sidebar. No more hunting through dropdowns –– users can locate what they need at a glance.
2. Improved Content Scannability with a New Grid Layout and Card Structure
We replaced the single-column feed with a three-column grid, fitting up to 12 cards above the fold. Condensed card sizes prioritized key metrics, eliminating unnecessary text and making the interface easier to digest.
These changes turned the abyss that was an average Kip Control feed into a more navigable, intuitive experience.
What We Learned
Redesigning Kip Control wasn’t just a technical exercise. It was an opportunity to reflect on what makes tools truly valuable to users.
Watching real users try to navigate the tool provided crucial insights for us to act on. For instance, users consistently struggled to find relevant analyses quickly. Observing this in action was like watching someone try to solve a puzzle with missing pieces. This frustration underscored the importance of discoverability: even the best content is useless if it’s buried under layers of complexity.
We were also reminded that iteration is vital. No product is perfect on its first try –– or its second! By treating each version as a stepping stone, we’ve built a foundation for continued improvement, guided by user feedback and evolving needs.
What’s Next for Kip Control
The redesigned Kip Control launched as a beta in late 2023 and was fully rolled out in 2024. Feedback from users has been very positive, with one user sharing:
"The new UI is great to navigate through – it makes it a ton easier to find an analysis vs the previous version where you had to scroll a lot more to find what you’re looking for. Love not having to scroll so far to find what I’m looking for."
But we’re not stopping there – we’re already eyeing opportunities for improvement. Some areas we're focusing on include:
- Making it easier to compare analyses over date ranges, and
- Moving away from a chronological timeline for better feed organization.
We’re confident that the redesigned Kip Control has laid the groundwork for these updates and more. The best is yet to come!